Dashboard Design
Data UX
2024
Client
Role
Services

The Problem
Global scale
Operations spanning multiple regions with no single source of truth for fleet and infrastructure health.
Reactive only
Teams were responding to failures - never anticipating them. Every alert was already an incident.
Data ≠ insight
Massive data availability masked the real problem: none of it was structured for operational decision-making.
01
Clarity over cleverness
Operators manage critical infrastructure in real time - cognitive load is the enemy. Every screen had to be legible under pressure.
02
Actionability over aesthetics
A beautiful alert nobody acts on is a failed design. Every data point was mapped to a possible action before it was allowed on screen.
03
Data availability ≠ usefulness
The system had enormous amounts of data. The design challenge was aggressive reduction - surfacing only what needed attention, right now.
04
Proactive over reactive
The shift from firefighting to forecasting required rethinking every alert, every threshold, every notification hierarchy from first principles.
05
Consistency across domains
One interaction model across five distinct operational domains meant operators could move fluidly between fleet, charging, energy, maintenance, and alerts.
Layer 1
Awareness
Network-wide health at a glance: fleet status, charging availability, energy load, and active incidents in a single view.
Layer 2
Investigation
Drill-down surfaces for understanding why something is happening: trends, anomaly context, and correlated signals.
Layer 4
Verification
Post-action confirmation and audit trails so operators always know what changed, when, and by whom.
1
Network & Site Monitoring
Regional/site-level visibility into charger availability, uptime, and overall network performance.
2
Charger & Session Monitoring
Real-time charger status, connector states, session activity, transaction information, and fault conditions.
3
Performance & Availability
Uptime, partially available chargers, failure trends, success rates, and operational KPIs.
4
Maintenance
Predictive maintenance queues, service history, and part-level failure patterns.
5
Alerts & Incidents
Unified incident feed with severity triage, escalation paths, and resolution tracking.
Platform Screens

Network Overview

Operational Clarity

Charging Infrastructure
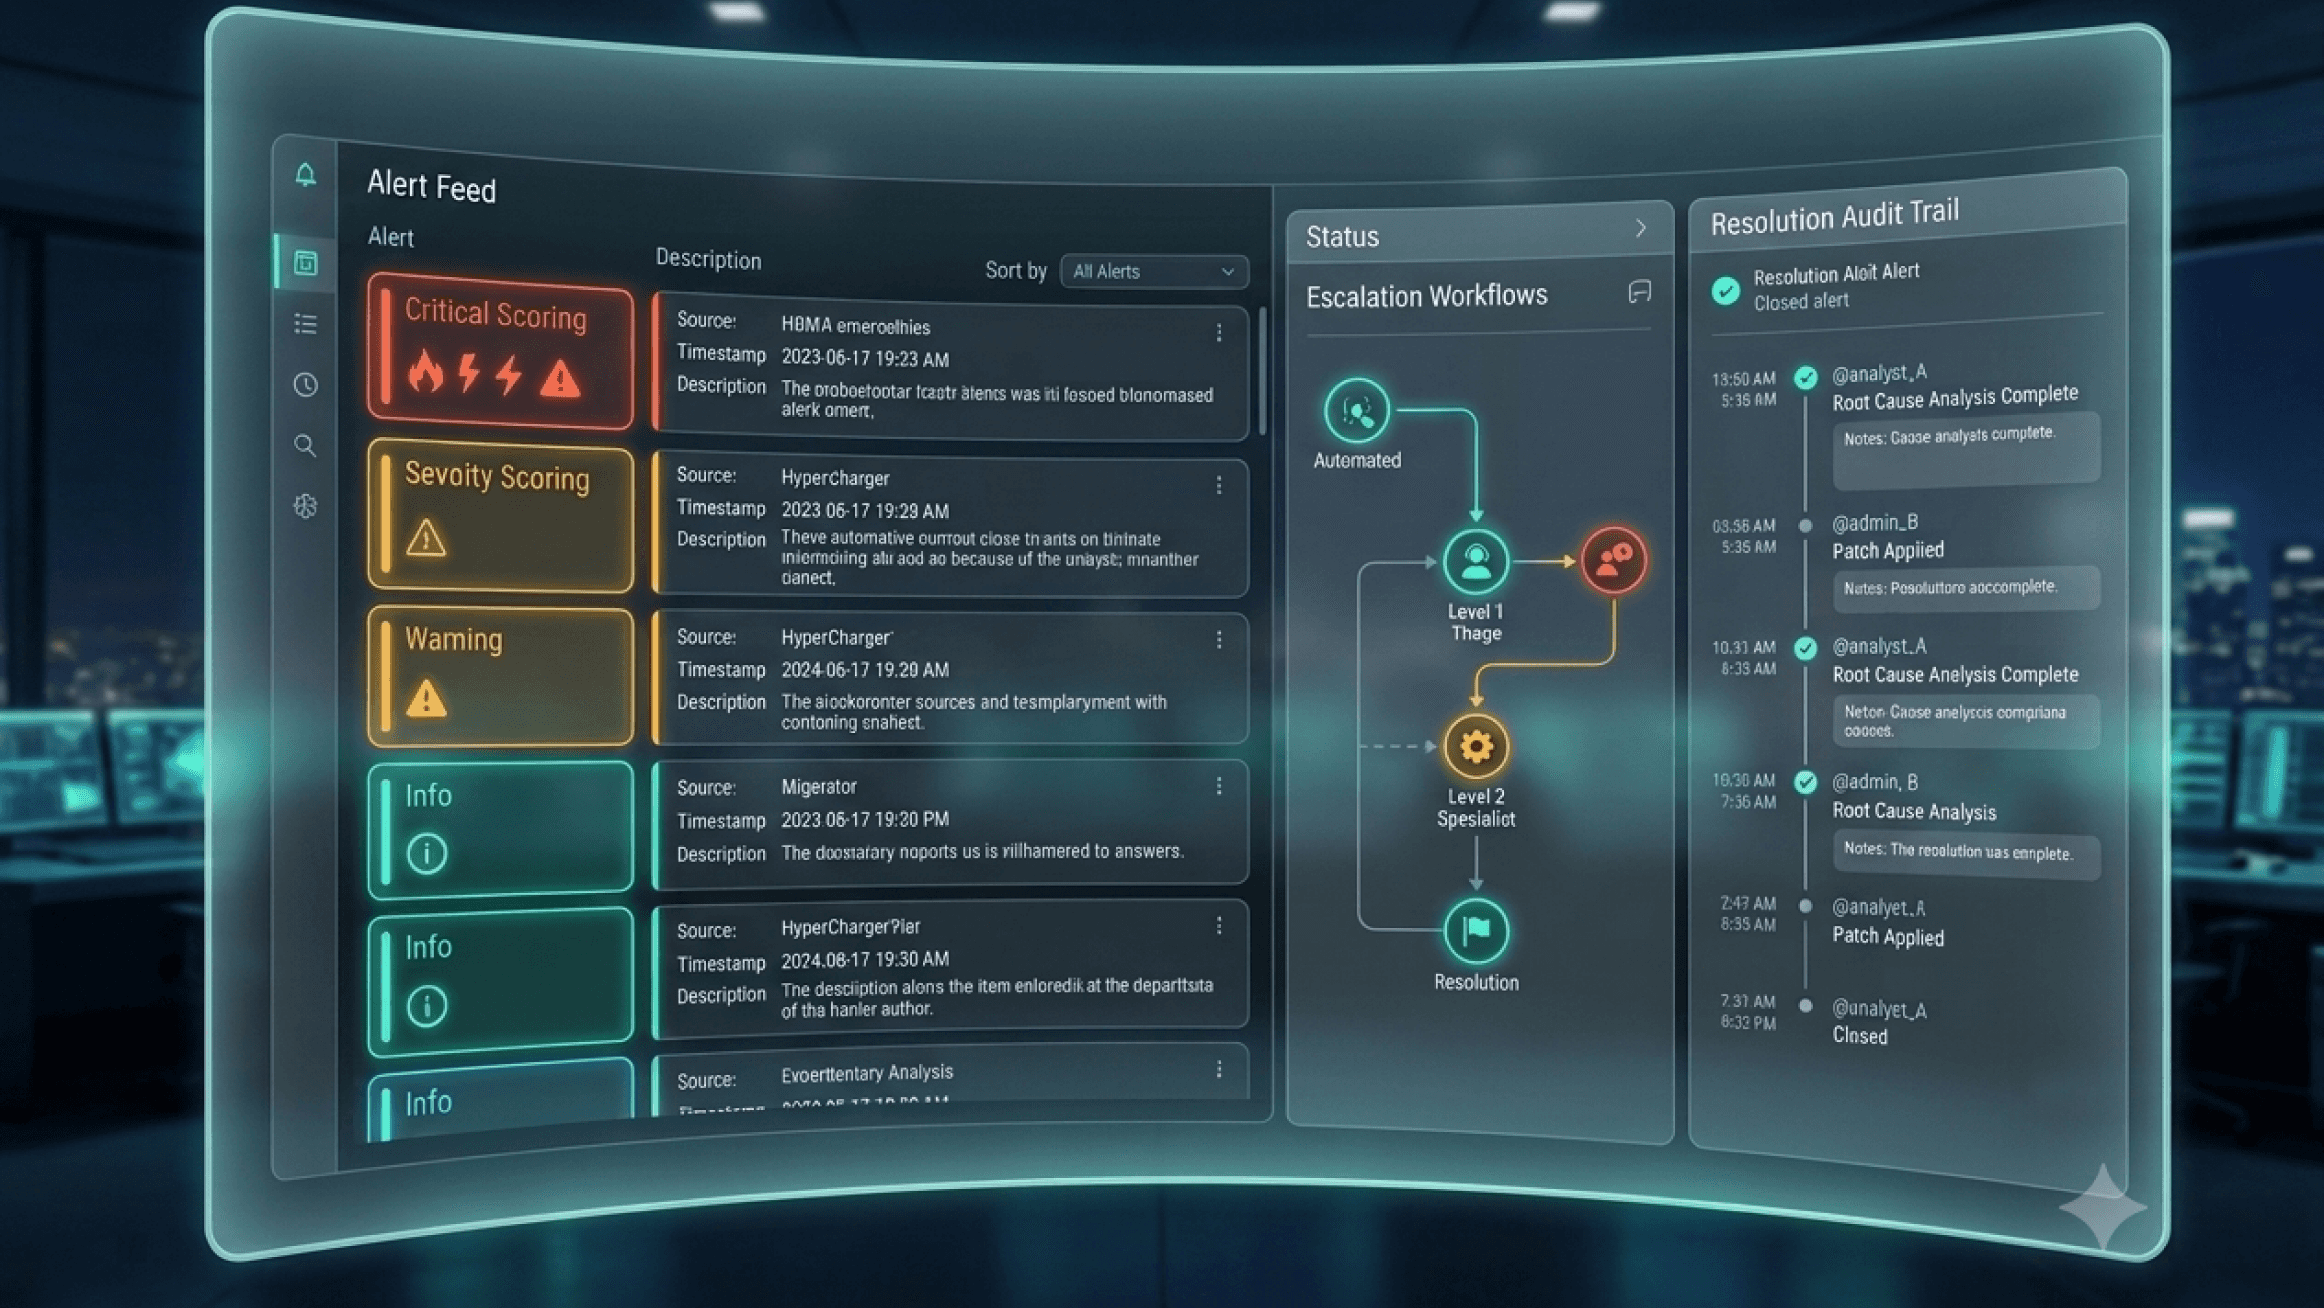
Incident Management
In the Wild

Analytics View

Fleet & Network Overview
Geographic fleet distribution, charging site availability, and live network health — all from a single awareness layer.
The Transformation
Operators moved from managing crises to preventing them. The platform gave a globally distributed team a shared language, a shared view, and the tools to act before things broke - not after.
5
Operational domains unified
4
Interaction layers
1
Consistent interaction model
Global
Fleet coverage
Interested?
Let's design systems that scale.